
The HCM1A0503V3-5R6-R datasheet frames DCR and Isat as the two primary electrical limits that determine converter efficiency, thermal headroom, and transient response. This article delivers a practical, measurement-aware walkthrough to interpret DCR and Isat numbers, extract usable design margins from the datasheet, and apply them to real DC‑DC converter choices for compact synchronous buck designs.
Background: Why DCR and Isat matter for high-current power inductors
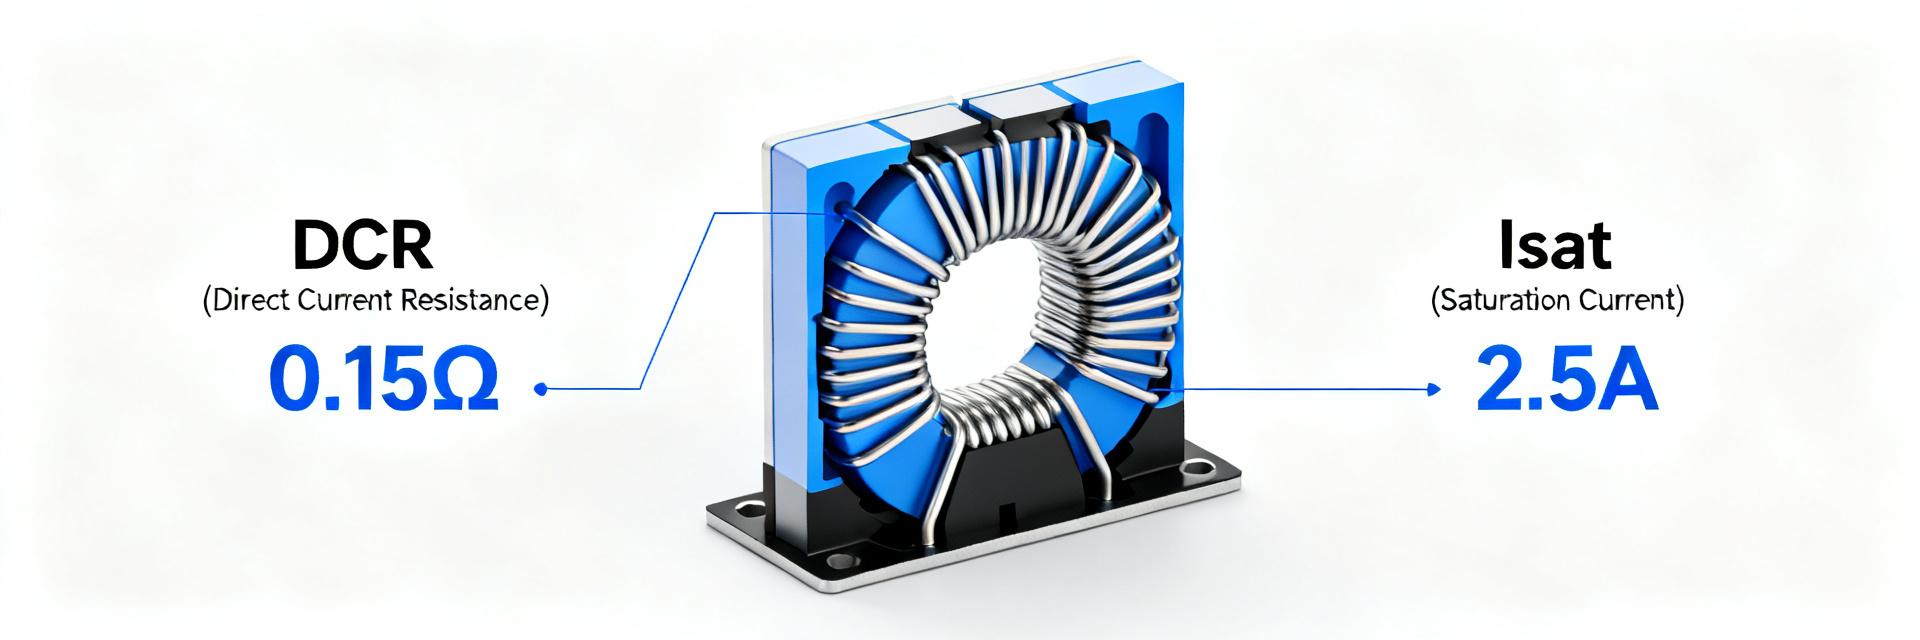
What HCM1A0503V3-5R6-R represents (form factor & target applications)
Point: The part identifier corresponds to a compact, high-current SMD power inductor in a 0503-style package with nominal 5.6 µH inductance. Evidence: Package footprint and 5R6 value position it for synchronous buck output filtering where ripple control and transient energy storage are both needed. Explanation: Designers reach for this family when board area is tight but ripple and peak handling remain critical.
Quick spec snapshot: common datasheet fields to scan first
Point: First-pass datasheet reading saves design time. Evidence: Scan inductance (FLL), DCR (max at specified temp), Isat definition, Irms, SRF, thermal/current derating tables and test conditions (frequency, Vrms). Explanation: Capture these values into a checklist to convert datasheet terms into thermal and efficiency budgets before layout or sourcing decisions.
DCR (DC Resistance) — measurement meaning and design impact
How DCR is defined and typical test conditions to watch for
Point: DCR is the conductor's DC resistance and directly sets copper loss. Evidence: Vendors report DCR at a reference temperature (commonly +20–+25°C) and in milliohms using 4‑wire or 2‑wire methods; temperature coefficient and measurement method change the number. Explanation: When comparing parts, normalize DCR to operating temperature using R(T)=R0[1+αΔT] and prefer 4‑wire referenced numbers for accuracy.
From DCR to copper loss and thermal rise: calculations and examples
Point: Convert DCR to power loss to estimate efficiency effects. Evidence: Core formula P_loss = I_rms^2 × DCR (W). Explanation: Example: at I_dc=3.0 A with 0.020 Ω DCR and 0.5 A ripple RMS, I_rms ≈ sqrt(I_dc^2 + Iripple_rms^2) ≈ 3.04 A → P_loss ≈ 0.020 × 3.04^2 ≈ 0.185 W. That loss maps into local temp rise depending on PCB thermal path and inductor Irms rating.
Isat (saturation current) — definition, measurement, and system effects
What Isat means in practice and how vendors define it
Point: Isat is the current at which inductance falls a specified percent and indicates usable peak energy before core saturation. Evidence: Common vendor definition uses the current where L drops 10–30% from low‑current FLL under specified test conditions. Explanation: Always read the percent drop and test conditions — different percentages give dramatically different numeric Isat values and must be compared apples-to-apples.
Isat vs Irms vs transient current: sizing for steady-state and peaks
Point: Isat governs transient peaks while Irms governs thermal limits. Evidence: A practical safety margin is Isat ≥ peak_current × 1.2–1.5 depending on application severity and ambient. Explanation: For a buck with 3 A DC and 2 A peak excursions, specify Isat > 2.4–3.0 A; verify worst‑case temperature because magnetic materials soften with heat and reduce effective Isat.
Practical characterization & test methods to verify datasheet numbers
Lab measurement checklist: tools, setups, and common pitfalls
Point: Verify datasheet claims in-house before production. Evidence: Required instruments include a 4‑terminal LCR meter, low‑resistance DMM, current probe and scope, and a controlled current source. Explanation: Use short, Kelvin connections to measure DCR, allow steady thermal conditions, and avoid relying on fixture leads — otherwise heating or lead resistance will distort results.
Reading and extracting curves: L vs I, DCR vs temperature, and loss curves
Point: Combine vendor curves to predict in-system behavior. Evidence: Extract L vs I to identify the practical Isat point, use DCR vs T coefficients to estimate operating resistance, and overlay P_loss across load to estimate efficiency. Explanation: Digitize PDF curves if needed but validate with spot measurements at the expected operating currents and temperatures.
Case study: choosing HCM1A0503V3-5R6-R for a 3 A synchronous buck (step-by-step)
Selection workflow: from datasheet numbers to part decision
Point: Use a repeatable workflow to accept or reject a part. Evidence: Define operating I_dc, expected ripple, peak transient, then compute I_rms, P_loss from DCR, check Isat margin and Irms thermal rating, and confirm SRF and footprint. Explanation: Build a small decision table (pass/fail) on DCR loss, Isat margin ≥1.3, and Irms rating; if any fails, move to an alternate inductor.
| Criterion | Threshold | Result |
|---|---|---|
| Calculated P_loss | <0.3 W | Pass/Fail |
| Isat margin | ≥1.3 × peak | Pass/Fail |
| Irms rating | ≥I_rms | Pass/Fail |
Example calculations and expected outcomes (efficiency and temp)
Point: Numeric walk-through clarifies trade-offs. Evidence: For a 12 V→5 V synchronous buck delivering 3 A, assume 0.020 Ω DCR and Iripple_rms=0.5 A → P_loss ≈0.185 W and approximate temperature rise 15–25°C depending on board cooling. Explanation: If Isat is specified at 3.5 A (20% L drop), a 3 A peak could be marginal; choose higher‑Isat or accept additional margin by adjusting switching frequency or Ferrite material.
Actionable checklist & troubleshooting for production and field issues
Pre-production checklist: validating specs and footprint
Point: Gate checks prevent redesign cycles. Evidence: Verify measured DCR/Isat at target temps, simulate PCB thermal profile, confirm clearance for reflow and pick‑and‑place, and ensure required qualification level. Explanation: Adding this gate reduces field failures caused by overheating or saturation during worst-case ambient or input conditions.
Troubleshooting guide: symptoms, root causes, and fixes
Point: Symptoms point to either thermal or magnetic limits. Evidence: Excess heating with low ripple often means high DCR; increased ripple or dropouts during transients points to Isat exceeded. Explanation: Fixes include layout changes, parallel inductors for shared current, selecting lower‑DCR / higher‑Isat parts, or derating based on measured curves.
Summary
Interpreting the HCM1A0503V3-5R6-R datasheet’s DCR and Isat fields correctly is essential for converter efficiency, thermal headroom, and transient performance. The practical steps are: a focused datasheet scan, calculate DCR-derived losses, apply an Isat safety margin for peaks, verify with lab measurements, and enforce a pre‑production validation checklist to avoid field issues.
Key summary
- Scan inductance, DCR, Isat, Irms and derating tables first — these entries convert directly to efficiency and thermal budgets and should drive initial part selection.
- Use P_loss = I_rms² × DCR to estimate copper losses; measure DCR with 4‑wire technique and normalize to operating temperature before accepting a part.
- Select Isat with margin (1.2–1.5× expected peak) and verify L vs I curves experimentally to ensure transient performance and avoid in-system saturation.
Common questions
How do I measure DCR reliably on a populated board?
Measure using a four‑terminal Kelvin method with the board unpowered and temperature stabilized; remove one end of the inductor if possible to avoid parallel paths. If in‑situ removal is impossible, account for PCB trace resistance and use a low-ohm DMM or LCR meter calibrated with a short.
What Isat margin should I use for buck converter transient events?
For most synchronous buck applications choose Isat ≥ peak_current × 1.2–1.5 depending on severity of transients and ambient temperature. Use the vendor’s L vs I curve to verify where inductance loss begins and test at worst‑case temperature to ensure margin holds.
How can I validate vendor curves quickly in the lab?
Set up a controlled current ramp and measure inductance with an LCR meter at each current step to reproduce L vs I. Simultaneously log part temperature and measure DCR at low current and elevated temperature to produce a DCR vs T curve for accurate loss modeling.
What are the key failure modes if DCR or Isat limits are exceeded?
Exceeding DCR limits leads to excessive thermal rise, efficiency drop, and risk of thermal runaway. Exceeding Isat limits causes magnetic core saturation, causing a sharp drop in inductance, which triggers massive current spikes, increased output ripple, and potentially destructive switch-node failure.


