
Point: For many modern DC‑DC converters and point‑of‑load rails, the right power inductor selection — especially a 1.8 µH device — often sets the limits for converter efficiency and thermal headroom. Evidence: engineering bench comparisons routinely show conduction loss from DCR and inductance drop under DC bias as primary drivers of efficiency loss. Explanation: designers must balance DCR, saturation current, and footprint: lower DCR reduces conduction loss but typically increases size or cost, while higher Isat preserves inductance at high DC bias but may raise DCR and thermal rise.
Point: The purpose of this article is to provide a rapid, engineer‑friendly spec summary and checklist for selecting 1.8 µH power inductors. Evidence: the guidance is distilled from common datasheet parameters, bench measurement practices, and practical thresholds used in power‑train validation. Explanation: use the compact rules and tables below to filter candidates quickly and prepare test requests that reveal real in‑circuit behavior.
1 — Quick Overview: What a 1.8 µH Power Inductor Is
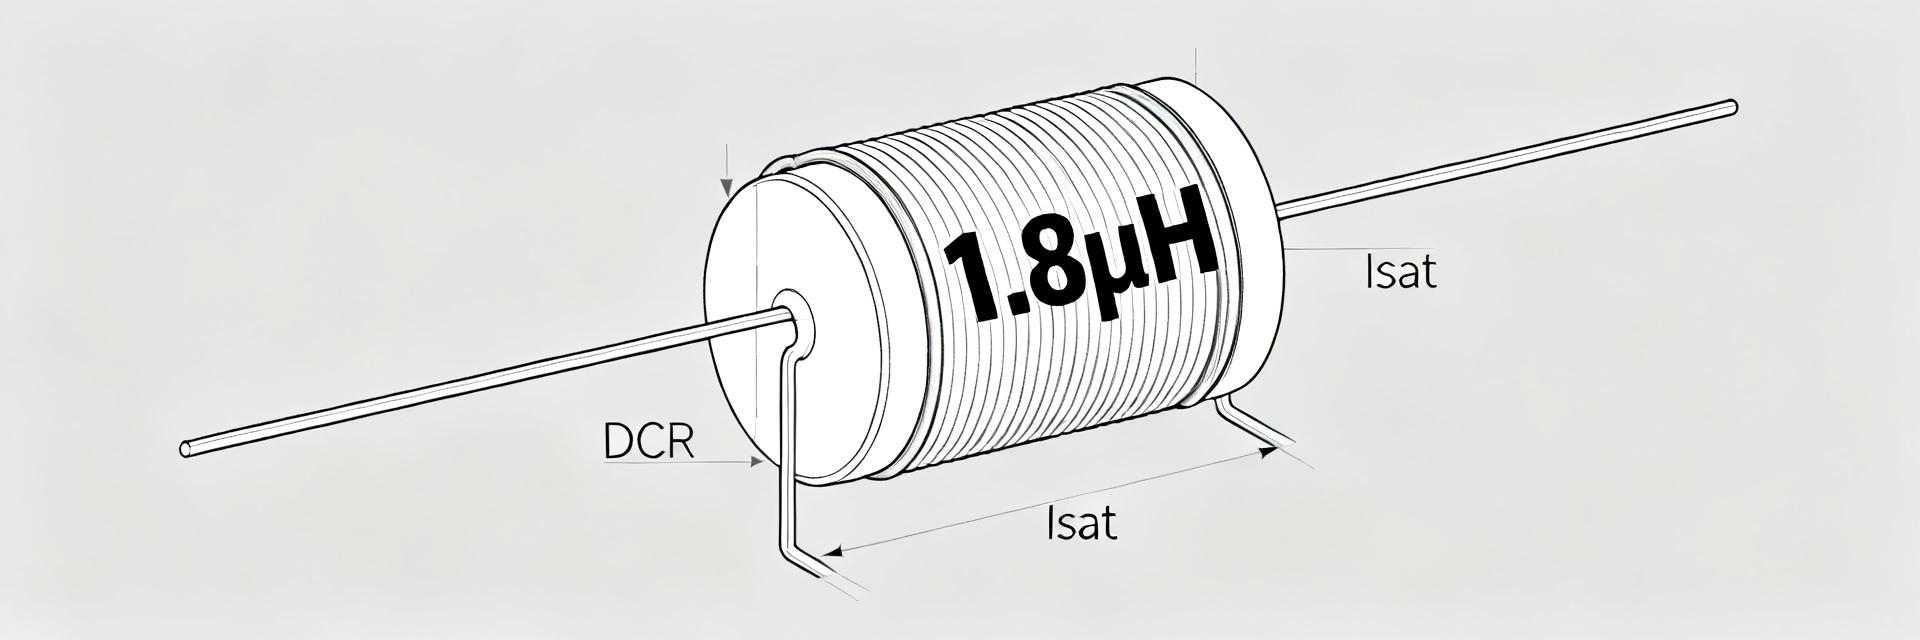
Definition & common applications
Point: A 1.8 µH inductance is a midrange value commonly used in synchronous buck converters switching in the low‑MHz to high‑100s kHz range. Evidence: typical applications include point‑of‑load regulators feeding CPUs, FPGAs, and memory rails where switching frequency is from ~300 kHz up to several MHz and DC currents range from a few amps to tens of amps. Explanation: the 1.8 µH value offers a balance between ripple current, transient response, and physical size for these frequencies and current densities.
Key trade-offs designers must know
Point: The central trade-offs are inductance vs. size, DCR vs. efficiency, and Isat vs. inductance retention under DC bias. Evidence: vendor datasheets and lab reports show inductance can fall 10–50% under DC bias and DCR trends dominate I²R loss at high currents. Explanation: prioritize low DCR when efficiency and thermal headroom matter; prioritize higher Isat when limited headroom forces higher DC current through the coil; accept slightly higher DCR for space‑constrained or cost‑sensitive designs.
2 — Essential Specs & How to Read Them
Inductance tolerance & frequency characteristics
Point: Inductance tolerance (±10%, ±20%, etc.) and the impedance vs. frequency behavior determine ripple current and EMI. Evidence: datasheets list nominal inductance at 100 kHz/0 A, plus impedance or inductance up to MHz; measured inductance often falls with frequency and DC bias. Explanation: read both the nominal tolerance and the impedance vs. frequency curve — a part with tight tolerance but poor high‑frequency impedance can underperform in MHz switching despite correct nominal µH.
DCR, Isat, Irms — definitions and practical impact
Point: DCR is DC resistance; Isat is the DC current at which inductance drops to a specified fraction; Irms is the continuous current rating for acceptable temperature rise. Evidence: DCR determines conduction loss (P=I²·DCR) and thermal rise; Isat is often given as the current for 10% inductance drop (or sometimes 1% for stricter definitions). Explanation: use DCR to estimate I²R loss and Irms to size thermal margin; verify Isat definition on the datasheet because vendor conventions differ and the effective inductance in‑circuit depends on DC bias.
3 — Measured Performance: What Bench Data to Request or Test
Recommended test data & measurement conditions
Point: Request or measure DCR vs. temperature, inductance vs. DC bias and frequency, Isat (1%/10% drop definitions), Irms heating, and core‑loss vs. frequency. Evidence: practical validation uses ambient 25°C baseline, inductance measured at switching frequencies representative of the converter, and Irms heating tests run until steady‑state temperature. Explanation: specify waveform (sine for inductance vs. frequency, DC bias plus small AC for L vs. bias), ambient, and measurement instrument resolution so vendor data maps to your in‑circuit expectations.
Interpreting graphs & pass/fail thresholds
Point: Read DCR curves to calculate conduction loss at operating temperature; read L vs. DC bias to estimate inductance at steady DC current. Evidence: an acceptable DCR typically keeps I²R loss below your efficiency budget (for example, <0.5–1% loss target at rated current), and Isat should provide 20–30% headroom above max DC current to avoid inductance collapse. Explanation: set pass/fail criteria: e.g., DCR such that P_loss ≤ specified watts at expected DC; Isat ≥ 1.2–1.3 × Imax; temperature rise at Irms ≤ 40–60°C depending on enclosure constraints.
4 — Selecting the Right 1.8 µH Part: A Practical Guide
Matching inductor to your converter spec
Point: Use a step checklist: determine max DC current, worst‑case ripple, target efficiency loss budget, allowed temp rise, and footprint limits. Evidence: for a converter with 10 A DC, estimate ripple current from L and fsw, then compute I²R losses using candidate DCR. Explanation: prioritize parts with DCR low enough to meet the efficiency budget; if board space is tight, accept slightly higher DCR but increase headroom on Isat or derate current; confirm Irms rating with vendor test or lab verification.
Trade-off examples (space vs efficiency vs cost)
Point: Three scenarios show common priorities: portable device (size), telecom/server VRM (efficiency), and industrial (robustness). Evidence: portable: choose compact 1.8 µH with moderate DCR and confirm thermal; VRM: choose low‑DCR, high‑Isat part even if larger; industrial: choose shielded, thermally robust part with conservative Irms. Explanation: match the priority (space, efficiency, life) to the inductor attribute to avoid overpaying or underspecifying.
5 — Quick Spec Table & Example Comparisons
Minimal spec sheet to include in procurement
Point: A compact spec template accelerates procurement and comparison. Evidence: include fields that map directly to performance in circuit (inductance, tolerance, DCR typ/max, Isat definition, Irms, SRF, size, mounting, temp rise @ Irms, shielding, compliance). Explanation: request measurement conditions and plots with every quote so datasheet numbers can be normalized across vendors.
| Part Number | DCR (typ) | Isat (10% drop) |
|---|---|---|
| HCM1A1305V3-1R8-R | 8.5 mΩ | 18 A |
| Candidate B | 5.2 mΩ | 15 A |
| Candidate C | 12 mΩ | 22 A |
How to create a 3-part short-list
Point: Filter parts by Isat/Irms first, then by DCR, then by footprint/availability. Evidence: a recommended margin is 20–30% headroom on Isat above expected DC; shortlist three that satisfy headroom and then compare DCR and physical constraints. Explanation: include the HCM1A1305V3-1R8-R as a candidate only if its DCR and thermal behavior meet your I²R and temperature rise targets measured under your conditions.
| DC Bias Current (A) | 0 A | 5 A | 10 A | 15 A | 20 A |
|---|---|---|---|---|---|
| Inductance L (µH) | 1.80 µH | 1.72 µH | 1.58 µH | 1.35 µH | 1.00 µH |
6 — Design & Implementation Checklist
PCB layout, thermal, and EMI tips
Point: Layout, vias, and shielding significantly affect performance and temperature. Evidence: minimizing switch‑node loop area reduces EMI; using multiple parallel vias under the inductor reduces thermal and current density; grounded shields reduce radiated emissions. Explanation: place the inductor close to the power stage, provide thermal paths for DCR heating, and verify radiated EMI with the intended capacitor and switch topology in place.
Validation & maintenance steps
Point: Prototype validation should include in‑circuit current and temperature profiling, long‑run thermal test, and vibration/aging checks. Evidence: thermal runaway and inductance drift often appear only after extended operation or under thermal cycling. Explanation: set lifecycle procurement rules (qualified alternates, cross‑reference criteria) and require sample reruns when supplier processes change.
Summary
Point: The three most important metrics for a 1.8 µH power inductor are DCR, Isat/Irms, and footprint/thermal constraints. Evidence: DCR sets I²R loss, Isat determines usable inductance under DC bias, and size dictates heat dissipation and layout options. Explanation: careful reading of DCR vs. temperature and inductance vs. DC bias data — plus bench measurement for your switching frequency and current waveform — is essential to ensure efficiency and reliability when specifying a power inductor such as a 1.8 µH device.
Key Summary
- Prioritize DCR: Target the lowest practical DCR that keeps I²R losses within the converter efficiency budget for your 1.8 µH choice; validate with DCR vs. temperature traces.
- Headroom on Isat/Irms: Require 20–30% headroom above max DC current to avoid inductance collapse and excessive temperature rise under real loads.
- Footprint vs Thermal Trade: If board space forces a higher‑DCR 1.8 µH part, plan for additional thermal vias or cooling and check EMI implications.
Frequently Asked Questions
What should I look for on a power inductor datasheet for a 1.8 µH part?
Look for DCR (typ and max), inductance tolerance, Isat definition (1% vs 10%), Irms rating and temperature‑rise data, L vs. DC bias and impedance vs. frequency plots, plus mounting/size and shielding. Always request test conditions so you can compare parts apples‑to‑apples.
How does DCR affect converter efficiency with a 1.8 µH power inductor?
DCR determines conduction loss (P=I²·DCR); small increases in DCR at high current produce significant efficiency penalties. Use the DCR value at operating temperature to estimate steady I²R loss and confirm with thermal testing at Irms.
How much Isat headroom is recommended for a 1.8 µH in high‑load designs?
Plan for about 20–30% headroom above the maximum steady DC current to limit inductance drop under bias; for pulsed or transient heavy loads, increase margin or choose a higher‑Isat part and validate with L vs. DC bias curves measured at your switching frequency.
How do PCB layout and shielding affect 1.8 µH inductor performance?
Minimizing the switch-node loop area minimizes EMI. Placing the inductor close to the power stage and utilizing multiple parallel vias under the component pads dramatically improves heat dissipation, reducing current-density choke and limiting thermal rise.


