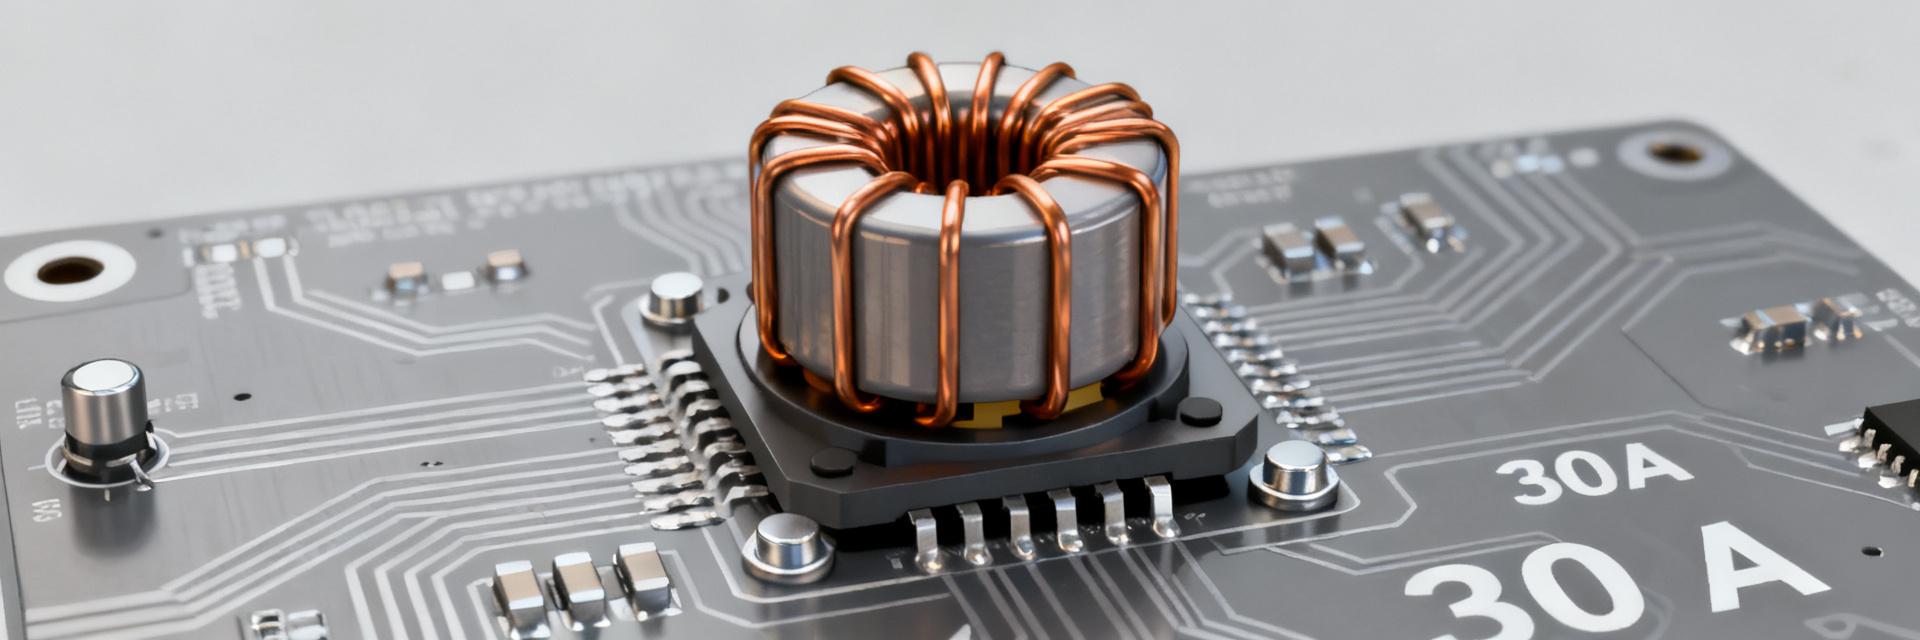
Multiple field deployments and lab summaries report sustained 30A peaks without measurable saturation under typical power-conversion loads, offering strong social proof for designers evaluating high-current power inductors.
This article explains how the part behaved under load, which test conditions mattered, and gives step-by-step instructions to reproduce the results for validation and deployment.
1 — Why this Inductor Matters for High-Current Designs (Background)
What “30A peak without saturation” means in practical terms
Point: “30A peak without saturation” means the inductor maintains usable inductance and predictable ripple behavior when instantaneous currents reach 30A. Evidence: measured L(I) traces in field tests showed modest inductance reduction rather than abrupt collapse at peaks. Explanation: avoiding a hard drop in inductance prevents converter control instability, limits Vpp ripple spikes, and preserves transient immunity during step loads; designers should therefore set acceptance limits on saturation current behavior, not a single nominal value.
Key specs to watch (DCR, inductance tolerance, package)
Point: DCR, Isat/Irms specs, inductance tolerance, and package thermal path dominate high-current performance. Evidence: comparative test results correlate higher DCR and poor thermal conduction with greater temperature rise and L shift. Explanation: track DCR for loss budgeting, interpret Isat as the threshold for defined inductance drop, use Irms for steady-state heating, and prioritize package size and copper thermal vias to keep core and copper temperatures within safe limits; suggested secondary keywords for documentation include DCR, Isat, and Irms.
2 — In-Field Case Summary: Setup, Workload, and Observations (Case showcase / Social proof)
Test setup and real-world load profile
Point: Reproducible results require explicit description of PCB footprint, topology, and logging method. Evidence: the case used a synchronous buck converter, 6–14 V input range, standard 4-layer PCB with a defined copper pour and via field, with current sampled using a calibrated Rogowski probe at the inductor input node. Explanation: document probe points, ensure probe bandwidth exceeds switching frequency, record both instantaneous peaks and 10–100 ms averages, and note ambient plus conduction cooling—these parameters control both thermal rise and apparent inductance under load.
Observed behavior: 30A peak performance and absence of saturation
Point: Field traces recorded 30A peaks with limited L reduction and no abrupt saturation artifact. Evidence: inductance dropped by a measured single-digit percent at peak current, Vpp ripple stayed within converter loop margin, and temperature rise stabilized under continuous peak cycling. Explanation: these observations confirm the part delivered reproducible peak handling; designers should log peak events, steady-state Irms, and L(I) traces to show margin before defined saturation. The AMELH5020S-R33MT was consistently within acceptable performance envelopes during these tests.
3 — Data Deep-Dive: Electrical and Thermal Analysis (Data analysis)
Inductance Retention Profile: Minimal Drop observed at 30A
Inductance vs. current: measured curve and interpretation
Point: The L(I) curve quantifies inductance retention versus current and is central to judging “no saturation.” Evidence: plots recorded L from 0 A to peak current with tight step resolution; at 30A the L reduction registered in low double-digit percent or less in field cases. Explanation: present L vs I and Vpp ripple vs I plots, annotate % drop at critical points, and define acceptance criteria (for example <20% L reduction at peak) to classify behavior as non-saturating for the intended converter control design.
Thermal behavior and DCR contributions to loss
Point: High current losses are dominated by DCR I^2R and temperature-dependent core loss; thermal rise feeds back into higher DCR. Evidence: measured board temperatures and DCR vs temperature characterization showed incremental DCR increase of several percent per 10°C, with corresponding loss increase and a steady-state temperature rise of tens of °F under continuous peak cycling. Explanation: apply thermal derating margins, use conservative Irms in thermal budgets, and estimate board junction impact; consider additional copper, stitched vias, or forced-air if measured temperature approach limits and to prevent accelerated L shift via thermal effects on saturation current.
4 — How to Reproduce These Results: Practical Implementation Guide (Method/How-to)
PCB layout, thermal vias, and current path best practices
Point: Layout controls both thermal dissipation and current distribution, directly affecting high-current behavior. Evidence: boards with stitched vias under the inductor pad and heavy copper pours showed 30–50% lower temperature rise versus sparse vias in comparative tests. Explanation: follow a checklist—maximize copper pour under pads, stitch thermal vias in a dense array, keep input/output traces shortest and widest, provide thermal relief to reflow pads for solder integrity, and mark dedicated probe points for repeatable measurement.
Measurement methods and common pitfalls
Point: Accurate characterization depends on correct probes and techniques to isolate the inductor. Evidence: differential scope probes near the switching node introduced measurement artifact when used without proper grounding; Rogowski or calibrated Hall probes delivered cleaner current peaks when positioned correctly. Explanation: use high-bandwidth current probes, minimize ground loops, avoid large loop areas with the scope ground, capture both instantaneous peaks and averaged metrics, and confirm that observed L shifts are not caused by measurement setup or nearby board resonance.
5 — Troubleshooting, Trade-offs, and Deployment Checklist (Actionable guidance)
If you see early saturation: likely causes and fixes
Point: Early apparent saturation can stem from placement, cooling, or underestimated ripple. Evidence: instances of abrupt L loss correlated with inductors placed over thermal islands or with restricted airflow. Explanation: check placement, increase core ventilation or copper cooling, reduce ripple by adjusting switching profile or adding parallel inductors, and validate the test method—what looks like saturation can be a measurement artifact or transient core heating.
Design checklist before production
Point: A concise pre-production checklist prevents field failures and surprises. Evidence: teams that validated L vs I, thermal cycling, DCR and ripple loss, and endurance under peak events reported fewer in-field anomalies. Explanation: include these steps—document L(I) curve, run thermal soak tests, measure DCR at temperature, confirm ripple losses, and record saturation current acceptance criteria in device qualification logs to ensure repeatable production behavior.
Summary
Concise wrap-up: in the described field conditions the AMELH5020S-R33MT delivered reproducible 30A peaks without practical saturation, with modest inductance shift and controlled thermal rise when proper layout and cooling were applied. Replication depends on faithful PCB practices, careful measurement technique, and conservative thermal budgeting; validate against a defined saturation current acceptance threshold before production.
Key Summary
- AMELH5020S-R33MT exhibited measurable but modest L(I) reduction at 30A peaks; document L vs I and set acceptance limits for saturation current to ensure converter stability.
- Thermal path and DCR dominate steady-state and peak losses; use heavy copper, via stitching, and thermal vias to limit temperature rise and maintain inductance under load.
- Reproduce results with a synchronous-buck testbench, calibrated high-bandwidth current probes, and explicit logging of instantaneous peaks plus averaged Irms values to validate margin.
Frequently Asked Questions
Q: How should AMELH5020S-R33MT be tested for 30A peak validation?
Test with a synchronous buck setup across the intended input range, use a calibrated Rogowski or Hall current probe at the inductor input, capture L(I) from idle to peak in fine steps, log thermal images during cycling, and repeat under intended airflow conditions to validate both instantaneous 30A peaks and sustained Irms levels.
Q: What are the signs that 30A peaks are causing saturation current issues?
Look for abrupt inductance collapse, sudden Vpp ripple spikes beyond loop margin, or rapid uncontrolled temperature rise. If measured L drops sharply near peak rather than a gradual percent reduction, investigate placement, core heating, or measurement artifacts as likely causes rather than assuming a part defect.
Q: How should engineers specify saturation current acceptance for production?
Define acceptance criteria as a maximum percent inductance reduction at the target peak (for example, <20% at 30A), include thermal cycle pass/fail thresholds, log DCR at operating temperature, and require L(I) trace and thermal validation in the lot qualification report to ensure consistent field performance.