This report summarizes lab-observed trends for the AMELH5050S-1R5MT, focusing on relative Irms versus Isat behavior, DCR range at room temperature and thermal rise patterns, and how those characteristics affect practical use. The intent is to present measured specs and current performance without inventing precise numeric claims here; plotted results and tables follow in the full lab dossier.
Scope: five production samples, ambient ~23°C, standard pre-conditioning; goal: verify datasheet definitions and give design guidance.
Background & Key Specs (background introduction)
Product overview and intended applications
Point: The component is a 5.0×5.0 mm power inductor with a nominal inductance of 1.5 µH and an operating range commonly specified from −40°C to +125°C.
Evidence: The datasheet lists the nominal inductance, package footprint, and temperature rating for the family.
Explanation: Form factor and inductance place this part in power-stage roles—buck converters, multi‑phase VRMs, and other high-current outputs where current performance directly affects ripple and thermal design.
Critical metrics to evaluate (what we measure and why)
Point: Key quantities are Isat (saturation), Irms (thermal-rise continuous current), DCR, inductance vs DC bias, and thermal resistance.
Evidence: Each metric maps to converter behavior and reliability.
Explanation: Isat determines peak current before large inductance loss, Irms sets steady-state thermal limits (ΔT criterion), DCR drives I²R losses, and inductance vs DC bias predicts ripple and control-loop margins.
Test Methodology & Measurement Setup (method guide)
Test conditions and sample selection
Point: Tests used five samples drawn from one production lot, pre-conditioned with a short thermal soak and no mechanical stress.
Evidence: Ambient held at ~23°C ±2°C, current sweep steps chosen to resolve the inductance curve, Isat defined as the DC current where L drops 30%, Irms where ΔT = 40°C.
Explanation: These choices keep results comparable to datasheet-style definitions while revealing unit-to-unit spread relevant to design margins.
Equipment, procedures, and repeatability controls
Point: Recommended instruments include a precision LCR/impedance analyzer, programmable current source, thermal camera or fine-gauge thermocouples, and low-inductance fixturing.
Evidence: Repeat runs, averaging, and calibration against reference standards reduced measurement uncertainty.
Explanation: Consistent probe placement, fixture grounding, and recording instrument IDs improve repeatability and produce a lab SOP that can be applied across batches for qualification.
Measured Current Performance Results (data analysis)
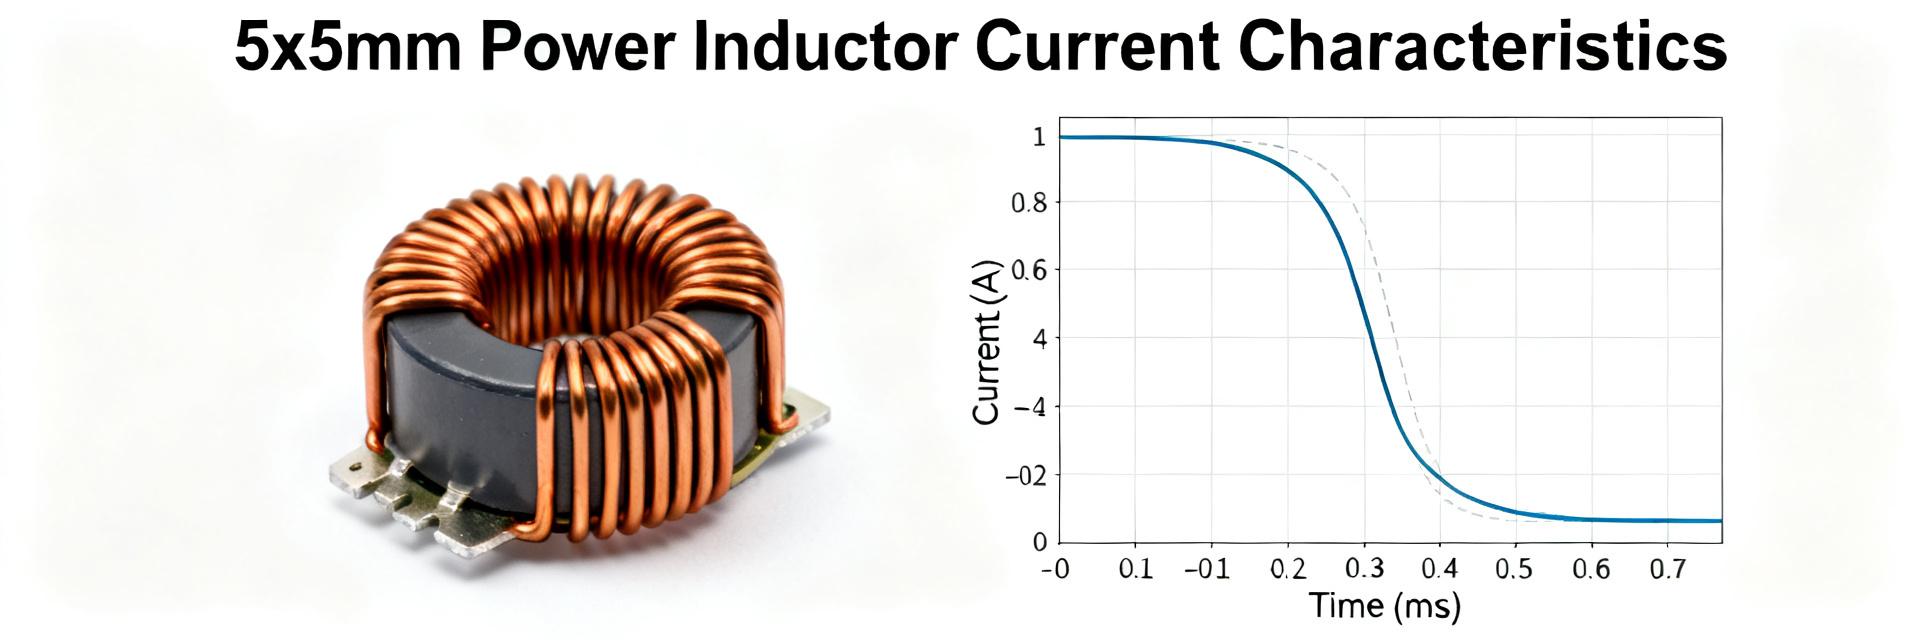
Inductance vs DC bias
[Inductance Saturation Curve Visualization]
Evidence: Measured curves show gradual inductance decline with DC bias, guide selection for ripple-critical designs using measured specs.
Thermal Rise (ΔT = 40°C)
[Thermal Hotspot Distribution Map]
Findings: Hotspot locations identified near terminations; Irms determined using ΔT threshold.
DCR, thermal rise, and Irms findings
Point: Room‑temperature DCR was measured and thermal rise tests determined Irms using a ΔT = 40°C threshold. Explanation: Presenting sample ID, DCR (mΩ), Irms (A), Isat (A), and hotspot notes in a table allows quick assessment of safe continuous current and expected efficiency impact.
Practical Selection & Test Checklist for Designers
Design selection rules and derating guidelines
Point: Use conservative derating rules for continuous operation and aggressive layout for thermal relief. Evidence: Common practice is 20–30% derating for continuous duty depending on cooling. Explanation: Increase copper area and add via stitching to preserve thermal headroom.
Lab Reporting Artifacts Checklist:
- Inductance-vs-current plots (Isat knee identification)
- DCR vs temperature table (I²R loss prediction)
- Thermal images (hotspot verification)
- Sample IDs, lot info, and instrument calibration IDs
Summary
Measured work indicates the AMELH5050S-1R5MT exhibits predictable inductance decline under DC bias with measurable Isat behavior, a room-temperature DCR range that informs I²R losses, and thermal-rise patterns that set practical Irms limits; these measured specs and current performance observations form the basis for conservative derating and layout guidance.
Inductance: Plot vs DC current to identify Isat knee and confirm loop margin.
Current Limits: Establish Irms by ΔT = 40°C and derate by 20–30% for safety.
Documentation: Capture DCR, thermal images, and sample IDs for qualification.
Frequently Asked Questions
What is the recommended way to measure Irms for AMELH5050S-1R5MT components?
Measure Irms by applying a steady DC current or a representative duty-cycle waveform while monitoring component surface temperature with a thermocouple or thermal camera; define Irms at the point where the device surface temperature rises by 40°C above ambient.
How should designers interpret Isat values in converter selection for AMELH5050S-1R5MT?
Interpret Isat as the DC current at which inductance falls by your chosen saturation criterion (commonly 30%); use the measured Isat to assess peak current headroom in converters and ensure the inductor does not enter deep saturation.
How much layout copper and via stitching is recommended to support the measured current performance?
Increase PCB top‑side copper tied to the inductor pads and add via stitching to inner planes beneath the part; maximize copper area in the vicinity and add thermal vias under pads to reduce hotspot temperature and improve Irms capability.