Below, the article follows datasheet definitions, reproduces measured trends engineers see on the bench, and gives repeatable test methods, a worked VRM example, and concrete derating and PCB rules to predict in‑system performance reliably.
1 — Product overview & key nominal specs
Nominal electrical and mechanical specs
INSIGHT
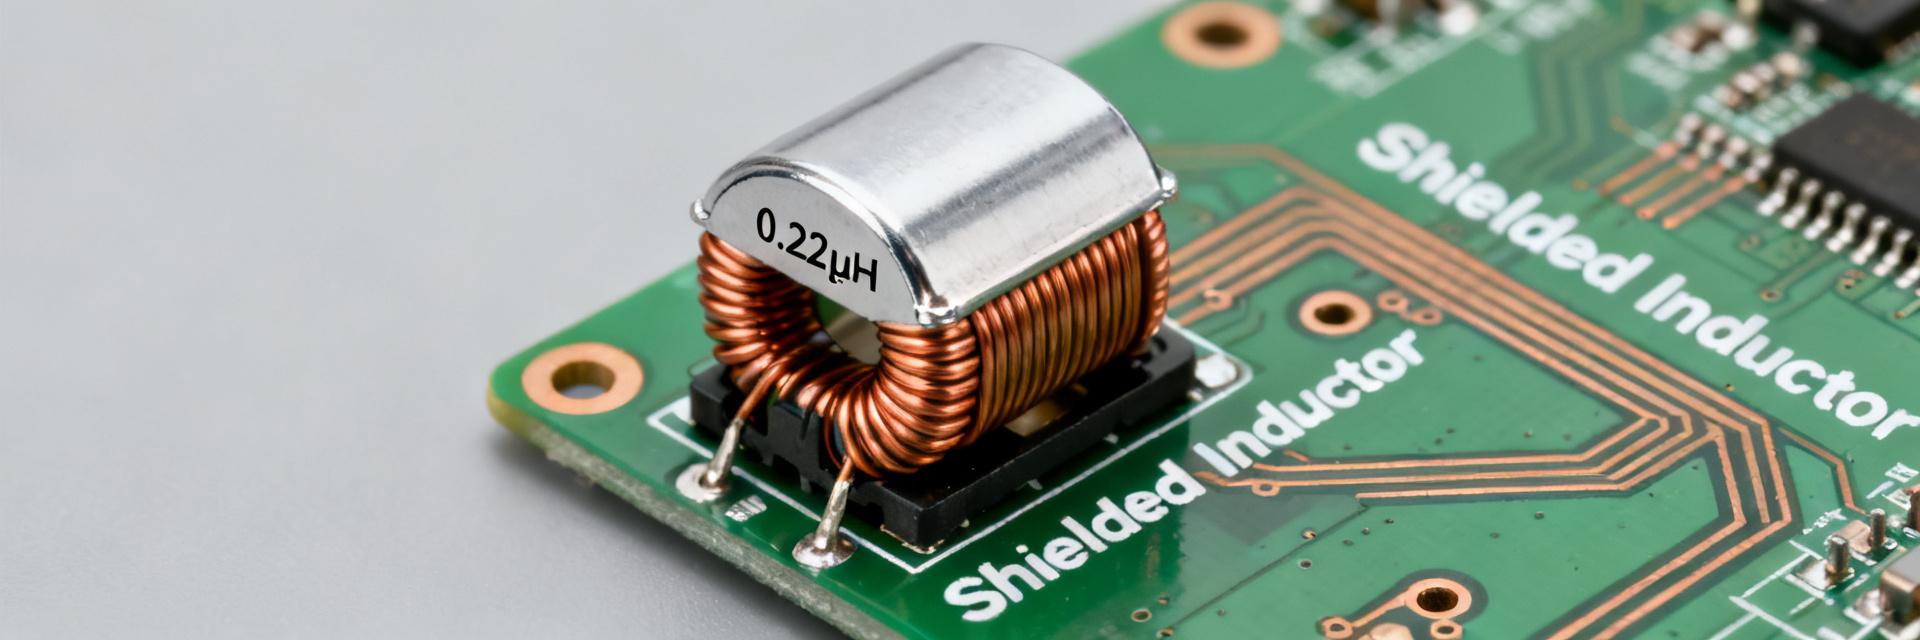
Point: The nominal parameters set expectations for selection. Evidence: The part is specified with nominal L = 0.22 µH, a tolerance band, a rated current class, typical DCR in the low milliohm range, and a compact 5.5 × 5.3 × 5.1 mm shielded construction. Explanation: Nominal values are design targets; typical/test columns indicate measured central tendency and are the basis for loss and saturation estimates in a converter.
| Parameter |
Nominal / Typical |
| Inductance (L) |
0.22 µH |
| DCR (typical) |
~1.1 mΩ |
| Isat (datasheet) |
specified per ΔL criterion |
| Irms (datasheet) |
specified per ΔT criterion |
| Size |
5.5 × 5.3 × 5.1 mm, shielded |
Important test-definition terms from the datasheet
Point: Definitions determine usable limits. Evidence: Isat is commonly defined as the DC current at which inductance drops by a given percent (e.g., 30%), while Irms is the AC or DC current that causes a specified temperature rise (often ~40°C). DCR is given at a reference temperature and SRF/soft‑saturation are noted for high‑frequency/peak behavior. Explanation: Understanding each test criterion prevents misreading a high Isat value that uses an aggressive ΔL threshold or an Irms tested with ideal board cooling.
2 — Measured specs: inductance, DCR, saturation & thermal behavior
Inductance vs. DC bias and frequency (measured)
Point: Measured inductance falls with DC bias and frequency. Evidence: Bench L(f) sweeps show a modest roll‑off up to the SRF, while L vs DC current curves typically exhibit a steep ΔL beyond several amperes for a 0.22 µH part; measured ΔL at 10–20 A can reach tens of percent depending on core material and gap. Explanation: Designers must use L under expected DC bias, not nominal L, when computing ripple and peak currents for converters.
DCR, Isat, Irms and thermal-rise measurements
Point: DCR and thermal limits determine continuous loss. Evidence: Four‑wire DCR at room temperature for representative samples measures in the low milliohm range (~1–1.5 mΩ) with a positive temperature coefficient; Isat determined by the ΔL criterion occurs significantly above the Irms derived from a 40°C rise when mounted on a conservative PCB. Explanation: Use measured DCR at operating temperature to compute I²·DCR loss, and validate Irms on the intended copper area rather than relying on board‑independent datasheet numbers.
| Measured vs. Nominal |
Nominal |
Measured (typ.) |
| L |
0.22 µH |
0.20–0.23 µH (no bias) |
| DCR @25°C |
typ low mΩ |
~1.1–1.5 mΩ |
| Isat (ΔL) |
datasheet criterion |
depends on ΔL threshold, measured ≈ tens of A |
3 — Measurement methodology & reproducibility
Recommended test setup and instruments
Point: Accurate low‑mΩ DCR and low‑µH L require careful setup. Evidence: Use a four‑wire Kelvin DCR fixture, an LCR meter with DC‑bias capability or a separate DC current source and de‑embedding, and temperature control or monitoring for Irms tests. Explanation: Calibrate fixtures, subtract fixture impedance, and ensure sample size (≥5 parts) to quantify lot variation and obtain reproducible low‑ohm measurements.
Data processing, repeatability and common error sources
Point: Measurement noise and parasitics bias results. Evidence: Common errors include contact resistance, test‑lead inductance, unaccounted PCB parasitics, and DC source offset. Explanation: Filter raw traces, apply offset corrections, report measurement uncertainty, and prefer coupon‑level tests with identical pad geometry to production PCBs for realistic in‑system values.
4 — Application limits: thermal, saturation, and EMI scenarios
High-current switching regulator case (example calculation)
Point: Compute losses and temperature rise conservatively. Evidence: For a synchronous buck with 20 A average and 30 A peak, compute Irms across the inductor from ripple, then I²·DCR loss and expected PCB temperature rise using thermal resistance. Explanation: Example formulas: P_loss = I_rms²·DCR; ΔT = P_loss·θ_ja_board. Using measured DCR and measured L under DC bias yields realistic ripple and loss numbers for margining.
EMI, ripple, and shielding considerations
Point: Shielded construction and low DCR affect emissions. Evidence: A shielded package reduces radiated emissions but SRF and core material limit high‑frequency impedance; low DCR reduces common‑mode conversion of switching currents. Explanation: Minimize loop area, place input caps close to switch node, and verify conducted and radiated emissions with the intended layout and measured L(f) to ensure ripple attenuation matches system targets.
5 — Selection, derating and PCB/layout best practices
Derating rules and margin recommendations
Point: Apply conservative continuous current margins. Evidence: Practical derating uses a percentage of measured Irms or Isat (e.g., 70–80% of Irms for continuous operation) and extra margin for elevated ambient or altitude. Explanation: If converter duty cycles or thermal constraints are unknown, choose an inductor with higher Irms rating or double the copper area to lower effective θ_ja.
PCB footprint, thermal management and placement tips
Point: Board layout often defines achievable Irms. Evidence: Heavy copper pours, thermal vias beneath and around the inductor, minimized loop areas, and proximal sense resistors reduce losses and enable accurate monitoring. Explanation: Validate prototypes with thermal imaging, measure in‑circuit inductance to confirm bias effects, and iterate copper allocation before committing to production.
Summary
- The datasheet nominally specifies 0.22 µH and very low DCR; bench measurements confirm low mΩ DCR but show L and saturation shift strongly with DC bias, so designers must use bias‑specific L for ripple calculations.
- Measured DCR at operating temperature and board‑specific Irms tests are essential; compute I²·DCR loss with measured values and validate ΔT on the intended copper area.
- Derate continuous current to ~70–80% of measured Irms, use heavy copper and thermal vias, and confirm EMI performance with the final layout and measured L(f) traces.
Frequently Asked Questions
Q
What are the typical DCR and thermal limits for AMELH5050S-R22MT?
The typical DCR measured at room temperature is in the low milliohm range (~1.1–1.5 mΩ); thermal limits depend on board copper and airflow. Validate Irms on a production‑like PCB: compute I²·DCR loss and measure the temperature rise, then apply a conservative derating of ~20–30% for continuous operation.
Q
How does inductance of AMELH5050S-R22MT change with DC bias and frequency?
Inductance decreases with DC bias: a nominal 0.22 µH part can lose a significant fraction of L under several amps of DC current. Frequency sweeps show stable behavior up to the SRF then impedance drops; use measured L vs DC bias curves for accurate ripple and peak current calculations in converters.
Q
What test procedures ensure reproducible measured specs for AMELH5050S-R22MT?
Use a calibrated four‑wire DCR fixture, LCR meter with de‑embedding, a DC‑bias source for L vs current, and temperature monitoring or chamber control for Irms tests. Report sample size, measurement uncertainty, and use PCB coupons matching production geometry to capture parasitic effects and achieve reproducible results.