Point: AMELH5050S-6R8MT delivers 6.8 µH inductance with a saturation current near 7.8 A and a self‑resonant frequency around 14 MHz—critical electrical numbers that drive suitability for power‑stage filtering.
Evidence: those values set the basic loss, ripple and high‑frequency behavior an engineer must budget.
Explanation: this article gives an engineer‑ready condensation of the core specs, practical selection rules, and test checkpoints to speed evaluation and prototype validation.
AMELH5050S-6R8MT — Quick specs snapshot (background)
Mechanical & package summary
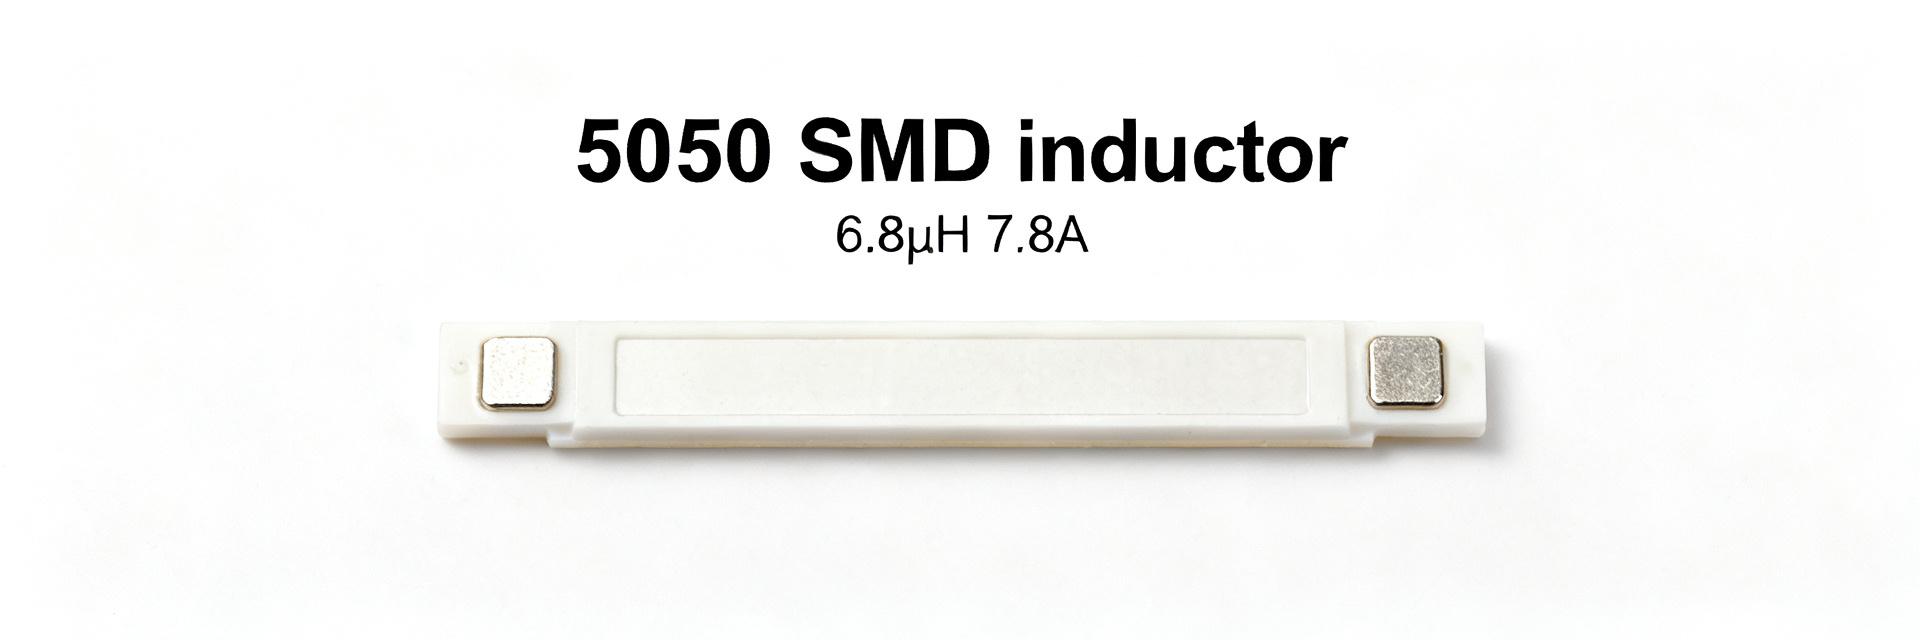
Point: The part is an SMD power inductor in a 5050 package with L×W×H dimensions close to 5.0×5.0×3.5 mm (nominal).
Evidence: typical 5050 family packages use a rectangular ferrite core and SMD terminations suited for reflow.
Explanation: designers should verify footprint tolerances and recommended land pattern from the manufacturer drawing, check clearance to adjacent components, and confirm reflow profile compatibility with flux and peak temperature limits before assembly.
Core electrical ratings at a glance
Point: Key electrical specs are summarized to give a rapid pass/fail for topology fit. Evidence: nominal inductance 6.8 µH; tolerance ±20%; DCR low milliohms; Isat ≈ 7.8 A; SRF ≈ 14 MHz. Explanation: note which values are typical versus guaranteed maximum during loss and stability calculations.
| Parameter | Value (typ / max) | Unit / Condition |
|---|---|---|
| Inductance | 6.8 (nominal) | µH |
| Tolerance | ±20% | - |
| DC Resistance (DCR) | ~10–30 | mΩ (typ/max) |
| Saturation current (Isat) | ≈ 7.8 | A (ΔL drop) |
| Rated / Irms | Thermal limit | RMS loss curve |
| Self‑resonant frequency (SRF) | ~14 | MHz (no‑bias) |
AMELH5050S-6R8MT electrical characteristics — DC behaviour & losses
DC resistance (DCR) and loss implications
Point: DCR sets I²R loss and efficiency impact in converters. Evidence: with several amps of RMS current, even tens of milliohms produce measurable watts of loss (P = I_rms² × DCR). Explanation: measure DCR with a four‑wire Kelvin method; include temperature dependence when budgeting losses.
Inductance vs. DC bias and tolerance
Point: Inductance reduces with applied DC bias. Evidence: ferrite‑based SMD inductors can see 20–50% L reduction at high DC currents. Explanation: use inductance‑vs‑current curves; size L so that ΔI and tolerance keep peak currents under Isat.
AC performance & frequency behavior (data analysis)
Self‑resonant frequency (SRF)
Point: SRF (~14 MHz) marks where the inductor becomes capacitive. Evidence: impedance plots show rising inductive impedance up to SRF. Explanation: choose switching and EMI filter frequencies well below SRF to avoid resonance issues.
Saturation & Thermal Limits
Point: Isat (~7.8 A) defines L collapse, while Irms governs continuous operation. Evidence: sustained peaks push the part into non‑linear regions. Explanation: apply derating (keep peak current ≤ 70–80% of Isat) and verify thermal rise.
Application & design guidelines (methods/guides)
Typical use cases and topology fit
Point: The part suits buck converters and input EMI filters. Evidence: 6.8 µH with ~7.8 A Isat is typical for medium‑power buck stages. Explanation: keep switching frequency below 1/10 of SRF; ripple should be 20–40% of desired inductor current.
PCB layout, grounding, and thermal best practices
Point: Layout affects thermal, EMI, and audible noise. Evidence: placement close to switching node minimizes loop area. Explanation: use 3–6 thermal/ground vias; avoid running sensitive traces beneath the part; use thermal imaging for verification.
Sourcing, equivalents, and pre‑production checklist (action)
Equivalent parts and substitution advice
Point: Compare L, Isat, DCR, SRF and package when substituting. Evidence: similar L values can have different core materials and loss curves. Explanation: verify DCR vs temperature and SRF when swapping; don't assume drop-in compatibility.
Testing & verification checklist before production
Point: A concise verification set prevents late surprises. Evidence: common failure modes include thermal overstress and insufficient saturation margin.
- Kelvin DCR measurement at controlled temperature to compare against datasheet.
- Inductance vs DC bias sweep to quantify L drop at expected peak currents.
- SRF/impedance sweep up to several tens of MHz to map resonance behavior.
- Thermal rise test at rated Irms with thermal imaging to validate cooling strategy.
- Board‑level EMI and conducted emissions scan with candidate part installed.