Latest datasheet metrics and bench tests show this compact power component targets high-current DC–DC designs with a favorable balance of inductance, DCR and thermal performance. This piece gives a concise, data-led snapshot so engineers can quickly screen, test and decide whether the part fits point-of-load and synchronous-buck applications.
Purpose: provide an actionable summary of key AMELH6020S-1R5MT specs, real-world performance indicators, recommended evaluation steps, simulation and layout guidance, plus procurement and sign-off checkpoints engineers can copy into lab notes and qualification reports.
Quick product overview and fit-for-purpose
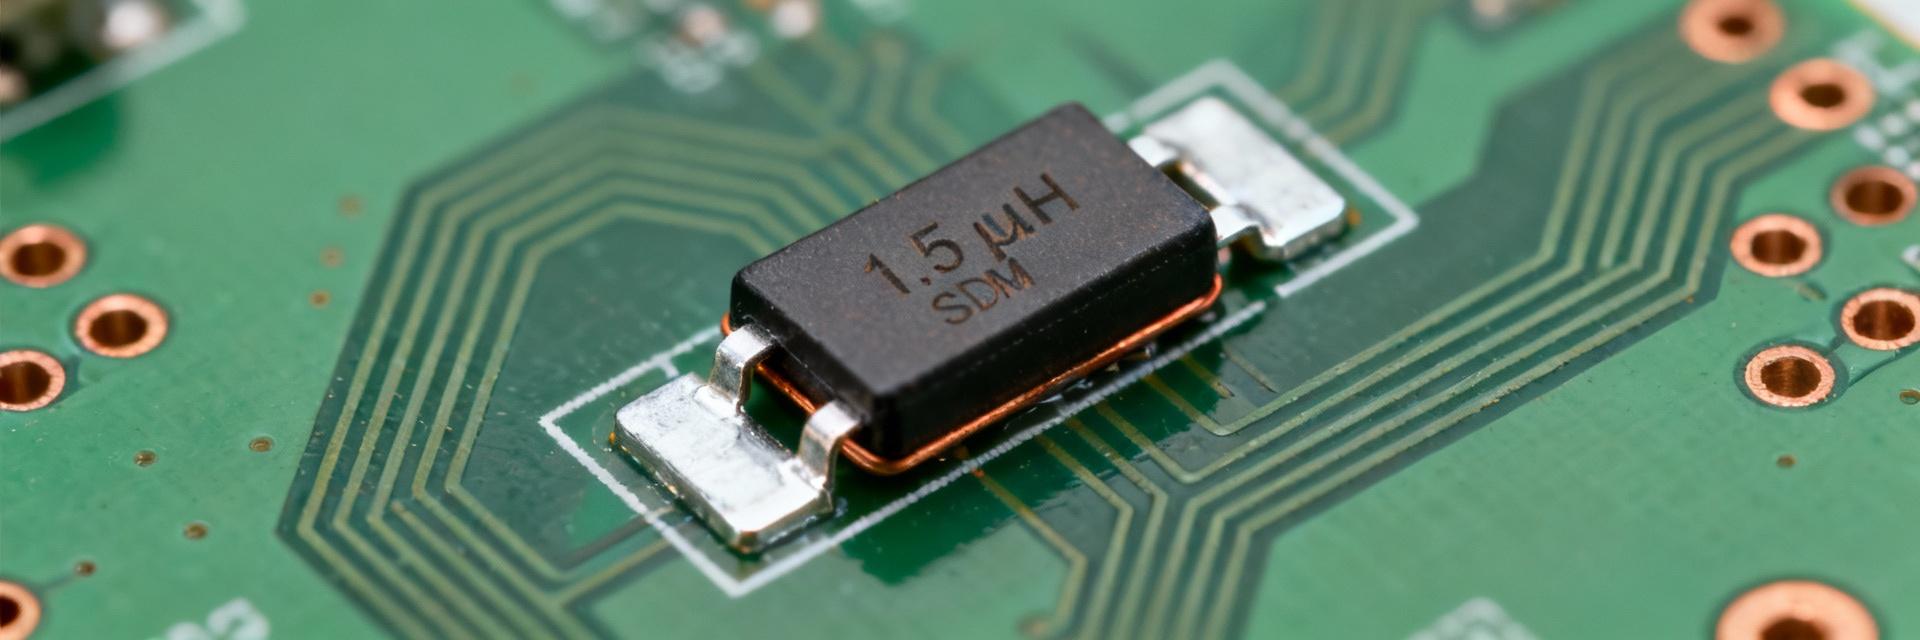
AMELH6020S-1R5MT appears as a surface-mount power inductor in a compact package optimized for high-ripple, high-current buck regulators. The part name implies a nominal inductance of 1.5 μH; the value trades off compact footprint and low DCR against DC-bias behavior to support 10–30 A class converters depending on thermal conditions.
What the AMELH6020S-1R5MT is (one-paragraph snapshot)
Point: a hot-pressed, flat-wire molded surface-mount power inductor designed for high-current DC–DC converters. Evidence: the datasheet indicates 1.5 μH nominal, low-profile form and construction optimized for low DCR. Explanation: this combination yields efficient energy storage for switching nodes while limiting losses, making it suitable where board area and thermal routing are constrained.
Key checklist for designers (quick bullets)
- ● Inductance under DC-bias — L vs I curve at converter bias point
- ● Saturation current and how Isat is defined on the datasheet
- ● DC resistance (DCR) at ambient and its temperature coefficient
- ● Rated current (Irms) vs thermal rise limits
- ● SRF and frequency-dependent impedance for switching harmonics
- ● Package footprint/height and board-stacking constraints
- ● Environmental ratings: RoHS and MSL level
Electrical & mechanical specs — quick reference table
Report a compact set of fields so comparisons are apples-to-apples. Include nominal values, test conditions and clear units to avoid misinterpretation when moving from datasheet to lab data.
Essential electrical specs to report
Point: provide a single-row-per-parameter table capturing conditions. Evidence: typical expected ranges guide screening—1.5 μH nominal, tolerance ±20%, DCR in single-digit milliohms, rated currents in double-digit amps. Explanation: these fields let thermal and loss budgets be calculated immediately for a candidate design.
Mechanical & environmental specs to report
Point: include board-level constraints. Evidence: report L×W×H, recommended land pattern, weight, solder profile and MSL. Explanation: height and footprint drive placement near connectors or under shields; include landing pattern to avoid reflow issues and to plan thermal vias if necessary.
Performance benchmarks & test data engineers care about
Engineers need curves and pass/fail thresholds more than raw numbers. Present impedance vs frequency and L vs DC-bias curves plus DCR/thermal-rise data tied to realistic converter currents.
Frequency & DC-bias performance (impedance and L vs current)
Point: show impedance vs frequency and L vs DC-bias. Evidence: capture 100 kHz–10 MHz impedance points and L at converter DC bias points (e.g., 5 V→1 V, operating DC current). Explanation: a steep drop in L with modest DC bias indicates early saturation; acceptable behavior is a gradual decline with usable inductance at operating current.
Thermal, loss and DCR behavior under load
Point: quantify I^2·R losses and thermal rise. Evidence: measure DCR vs temperature and run thermal-rise tests at rated ripple and DC currents. Explanation: calculate copper losses (I^2·DCR) and compare thermal rise to allowed junction/board limits; use these figures to size copper pours and vias for cooling.
How to evaluate and model AMELH6020S-1R5MT for your design
Measurement and modeling complete the selection process: consistent test methods and frequency-dependent models let simulation match lab results and avoid surprise behavior in production.
Measurement checklist & lab setup
Point: a short procedural checklist prevents mis-measurement. Evidence: use an LCR meter with proper fixture, Kelvin DCR measurement for milliohm values, bias tees or DC bias supplies for L vs I. Explanation: record test frequency, ambient temperature, fixture inductance and probe method; recommended frequencies include 100 kHz and converter switching frequency harmonics.
Simulation & PCB integration tips
Point: extract R, L and frequency-dependent impedance for SPICE/EM. Evidence: include parasitic R, ESR trend and SRF in models; layout guidance: keep inductor close to switching node, provide short thermal return paths and thermal vias under the land pattern. Explanation: these steps reduce EMI, improve transient response and ensure thermal dissipation aligns with lab-tested limits.
Typical applications, comparisons and alternatives
Use-case mapping speeds selection: list typical topologies and offer succinct substitution criteria so designers know when to choose or seek alternatives.
Best-fit application cases
Point: target synchronous buck and point-of-load regulators. Evidence: compactness and low DCR make it suitable for rails such as 5 V→1 V at 10–25 A. Explanation: in tight layouts where board area and profile are limited, this part balances conduction losses and inductor volume for efficient conversion.
When to consider alternatives (selection criteria)
Point: define common trade-offs. Evidence: if DCR must be lower for higher efficiency, choose a larger or different construction; if thermal headroom is limited, consider taller or larger footprint options. Explanation: compare DCR, rated current, height and thermal spec; substitutions must be verified by the same bench tests described above.
Procurement, testing roadmap and go/no-go checklist
Practical QC and procurement rules reduce risk in production. Define minimum qualification buys, incoming test sampling and sign-off criteria before volume release.
Sourcing & QC checklist for production
Point: recommend qualification steps. Evidence: run incoming visual/dimensional inspection and electrical spot checks (DCR and inductance) on sample lots; maintain lot traceability and sample size records. Explanation: initial buys should cover engineering samples and a qualification lot to verify consistency across manufacturing batches.
Final design sign-off criteria
Point: compact sign-off template speeds decisions. Evidence: require L within spec at operating DC-bias, DCR within X% of spec, thermal rise within allowed margin at rated current, mechanical fit confirmed and supply-chain lead-time acceptable. Explanation: use pass/fail thresholds in a short checklist to finalize component approval for production.
Summary
- ● AMELH6020S-1R5MT functions as a compact power inductor well suited for high-current DC–DC buck converters; confirm L at operating DC-bias and DCR for loss budgets.
- ● Key electrical specs to capture: nominal inductance, DCR, Irms/Isat and impedance over 100 kHz–10 MHz; include test conditions to ensure comparable data.
- ● Layout and procurement must-dos: place near switching node, provide thermal vias, perform incoming QC sampling and require thermal-rise verification before sign-off.
Frequently Asked Questions
Technical guidance is general; always validate with the manufacturer's latest datasheet and your lab-specific test fixtures and conditions.