Designers often find that an inductor that looks correct on paper underdelivers in real systems—excess heating, unexpected saturation, or higher-than-expected losses can break efficiency and reliability targets. This guide presents practical, testable steps for the AMELH6020S-R36MT to address those failure modes and restore margin quickly.
The approach below emphasizes concrete measurements, layout tactics, and trade-offs so teams can prioritize actions that reduce losses, avoid saturation, and meet thermal goals. Calculations are intentionally simple (P = I²·R, ΔT ≈ P·θJA) for rapid verification on the bench and in-field.
Background: AMELH6020S-R36MT in Power Designs
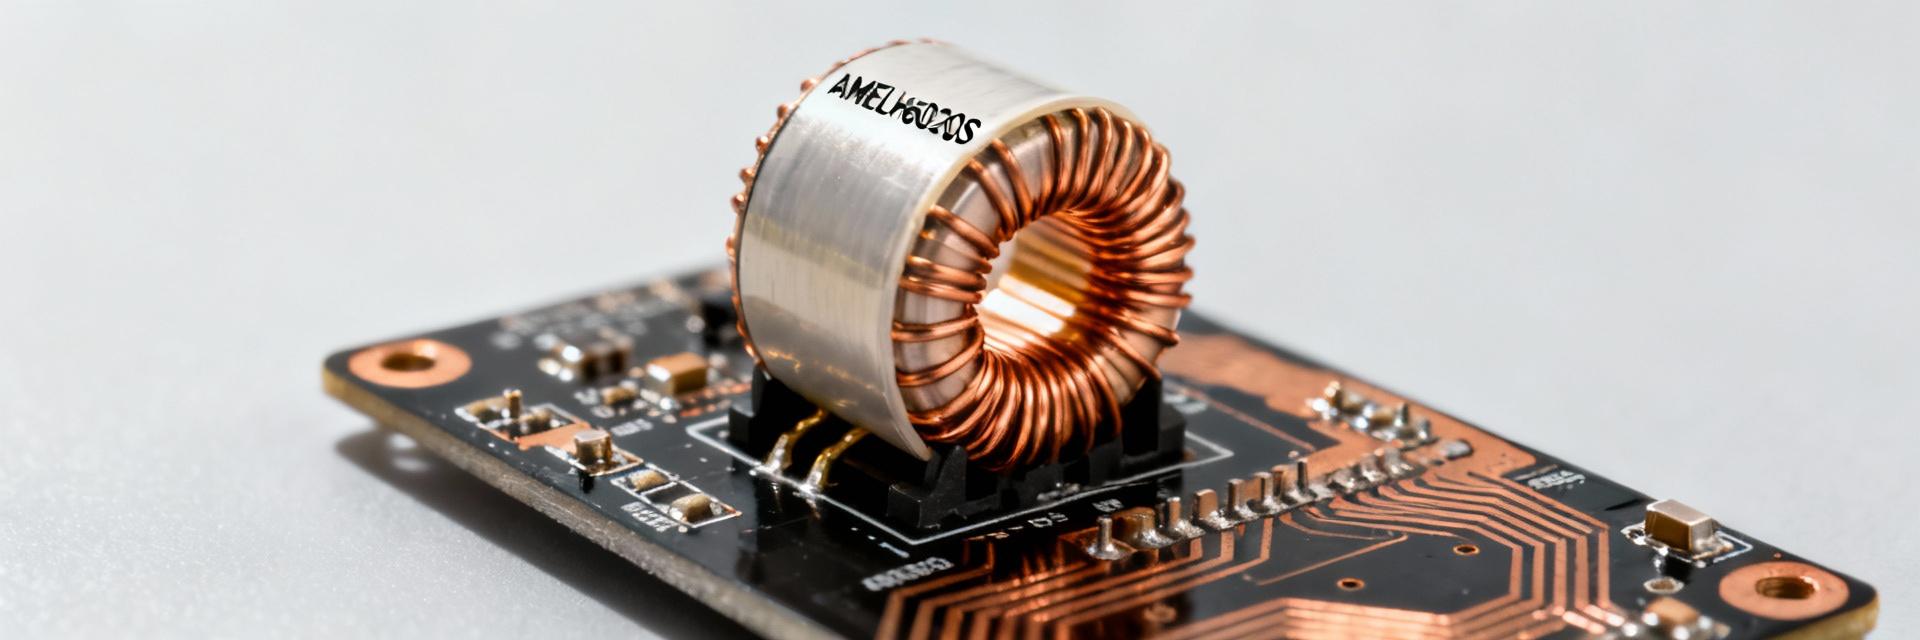
Key Electrical and Thermal Specs
Understand the critical specs: inductance (µH), DCR (mΩ), saturation current (Isat), SRF (MHz), and operating temperature (°C). Inductance controls ripple magnitude, while DCR sets continuous copper loss (Pcu = I_rms²·DCR).
Topology Relevance
Ideal for synchronous buck/boost converters in 5V/10A-class rails. Switching frequency dictates AC losses (skin/proximity effects). Higher frequencies reduce effective inductance near the Self-Resonant Frequency (SRF).
Performance Factors and Data-Driven Limits
Copper Loss Calculation Example
Note: This wattage translates directly to temperature rise based on thermal resistance (ΔT ≈ P_total·θJA).
Electrical Limits: Saturation & AC Losses
Derate peak sinusoidal or pulse currents by 20–30% to maintain inductance. For a converter with 30A peak pulses, target Isat ≥ 36–40A. Be aware that at high switching frequencies, skin effects increase effective resistance beyond the DC DCR estimate.
Thermal Behavior & Derating
If θJA ≈ 20 °C/W and P_total = 1W, expect a 20 °C rise. Improve thermal conduction using PCB copper pours and multiple vias to keep the AMELH6020S-R36MT safely below its maximum rated operating temperature.
PCB Layout Techniques to Maximize Performance
- ✔ Place inductor within 2–3 mm of the switch node to reduce loop inductance.
- ✔ Use ≥2 oz copper or multiple 1 oz pours for heavy current paths.
- ✔ Add 6–12 thermal vias under the pad area tied to internal planes.
EMI Mitigation
Orient the inductor axis to minimize coupling to sensitive loops. If core loss dominates at high frequencies, consider shielding or adjusting the switching frequency as a trade-off.
Testing and Characterization Protocols
| Test Parameter | Methodology | Pass Threshold |
|---|---|---|
| DCR Verification | Measure with milliohm meter at room temp. | Within ±10% of datasheet spec. |
| DC Bias Sweep | Apply incremental DC current while monitoring L. | Inductance drop |
| Thermal Profile | Thermal camera capture after 30min steady state. | ΔT within design margin (e.g., |
| System Efficiency | Input/Output power measurement at full load. | Meets target efficiency curve. |
Implementation Checklist
- Peak current ≤ 70–80% of Isat under worst-case.
- Compute P = I_rms²·DCR and ΔT = P·θJA.
- Copper pour + thermal vias under/around inductor.
- Monitor for audible noise during load transients.
- If thermal limits are met, prioritize lower DCR.
Case Study: 5V/10A Buck Converter
For a 5V/10A buck with 30% ripple current (ΔI≈3A):
- Derate Isat by 25% for safety.
- Calculate Pcu with I_rms and measured DCR.
- Add thermal vias to internal ground planes.
- Result: Efficiency recovered by ~0.4% and thermal margin increased by 12°C.
Frequently Asked Questions
How do I verify AMELH6020S-R36MT saturation in my design? +
Measure inductance versus DC bias by applying incremental DC current while monitoring L. A sharp drop indicates nearing saturation. Define a pass threshold (e.g.,
What PCB layout changes most reduce losses for AMELH6020S-R36MT? +
Shorten switch-to-inductor traces, maximize trace width, and use multiple thermal vias under a copper pour to spread heat. These steps cut parasitic resistance and thermal impedance, reducing I²·R losses and steady-state temperature.
How should I test AMELH6020S-R36MT at system level for optimization? +
Run converter load-step tests with capture of input/output voltages, inductor current, and temperature. Measure efficiency across the load range, record output ripple, and inspect for audible noise. Correlate results to bench DCR data to identify high-leverage optimizations.