AMELH6030S-3R3MT power inductor datasheet: key specs
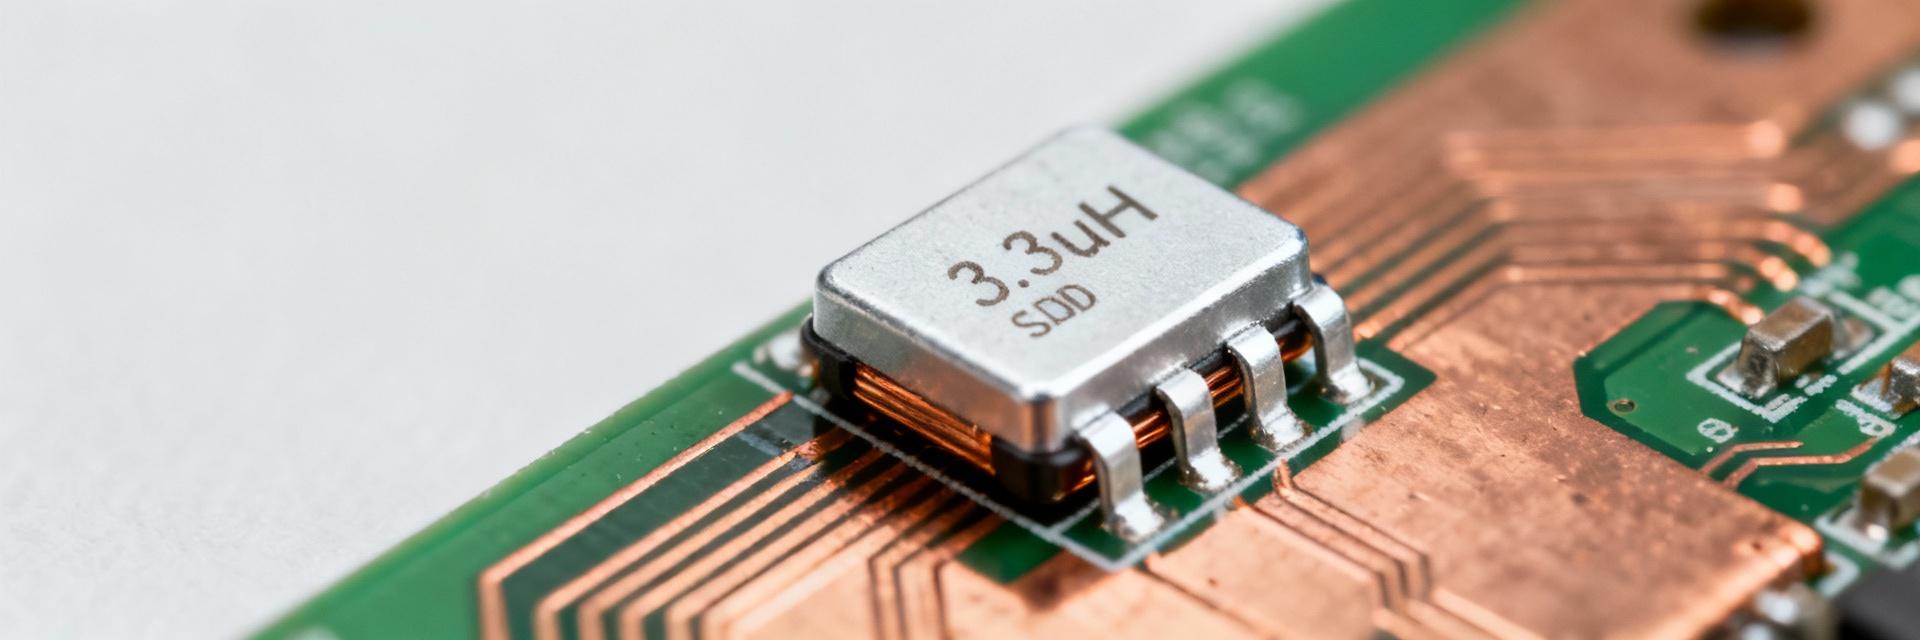
Point: The AMELH6030S-3R3MT is a surface-mount power inductor specified at 3.3 µH in a compact 6.8 × 6.6 × 3.1 mm package, rated for typical operating voltage near 40 V and an operating temperature range of −40 °C to +125 °C. Evidence: those headline values appear in the manufacturer datasheet and product summary. Explanation: these headline numbers drive selection decisions for current handling, loss budgeting and thermal headroom in high-current DC–DC converters.
Point: Designers need concise, datasheet-driven guidance rather than marketing text. Evidence: comparing nominal inductance, Isat/Irms, DCR and package height quickly filters candidates. Explanation: this article walks through the datasheet items that determine whether AMELH6030S-3R3MT fits a given buck or point-of-load design and how to validate them on the bench.
Overview & identification — quick reference
Primary specifications at a glance
Point: Key parameters belong in a single reference table so engineers can scan suitability. Evidence: datasheet lists nominal inductance, tolerance, test frequency, package dimensions, part marking, DCR, Isat/Irms, operating voltage and temperature range. Explanation: the table below highlights available headline entries; consult the official datasheet for exact numeric rows not shown here.
| Parameter | Specification / note |
|---|---|
| Nominal inductance | 3.3 µH |
| Inductance tolerance | See official datasheet for tolerance codes |
| Test frequency for L | Specified in datasheet (refer to L-measurement conditions) |
| Package dimensions (L×W×H) | ~6.8 × 6.6 × 3.1 mm |
| Nominal part marking | Refer to datasheet marking table |
| Typical DCR | See datasheet for typical and maximum DCR values |
| Rated Isat / Irms | See datasheet for saturation and RMS current ratings |
| Operating voltage | Typical ~40 V (refer to datasheet for absolute ratings) |
| Operating temperature | −40 °C to +125 °C |
Typical applications and selection rationale
Point: The AMELH6030S-3R3MT package and inductance target high-current DC–DC stages such as synchronous buck outputs and point-of-load regulators. Evidence: 3.3 µH in a 6.8 mm footprint balances energy storage and compact PCB real estate. Explanation: for switching frequencies in the 200 kHz–2 MHz range and continuous currents near the inductor’s Irms, the part offers a useful size‑vs‑current compromise; designers should map switching frequency and ripple current to required inductance and loss budget.
Electrical characteristics — datasheet deep-dive
Inductance behavior and frequency response
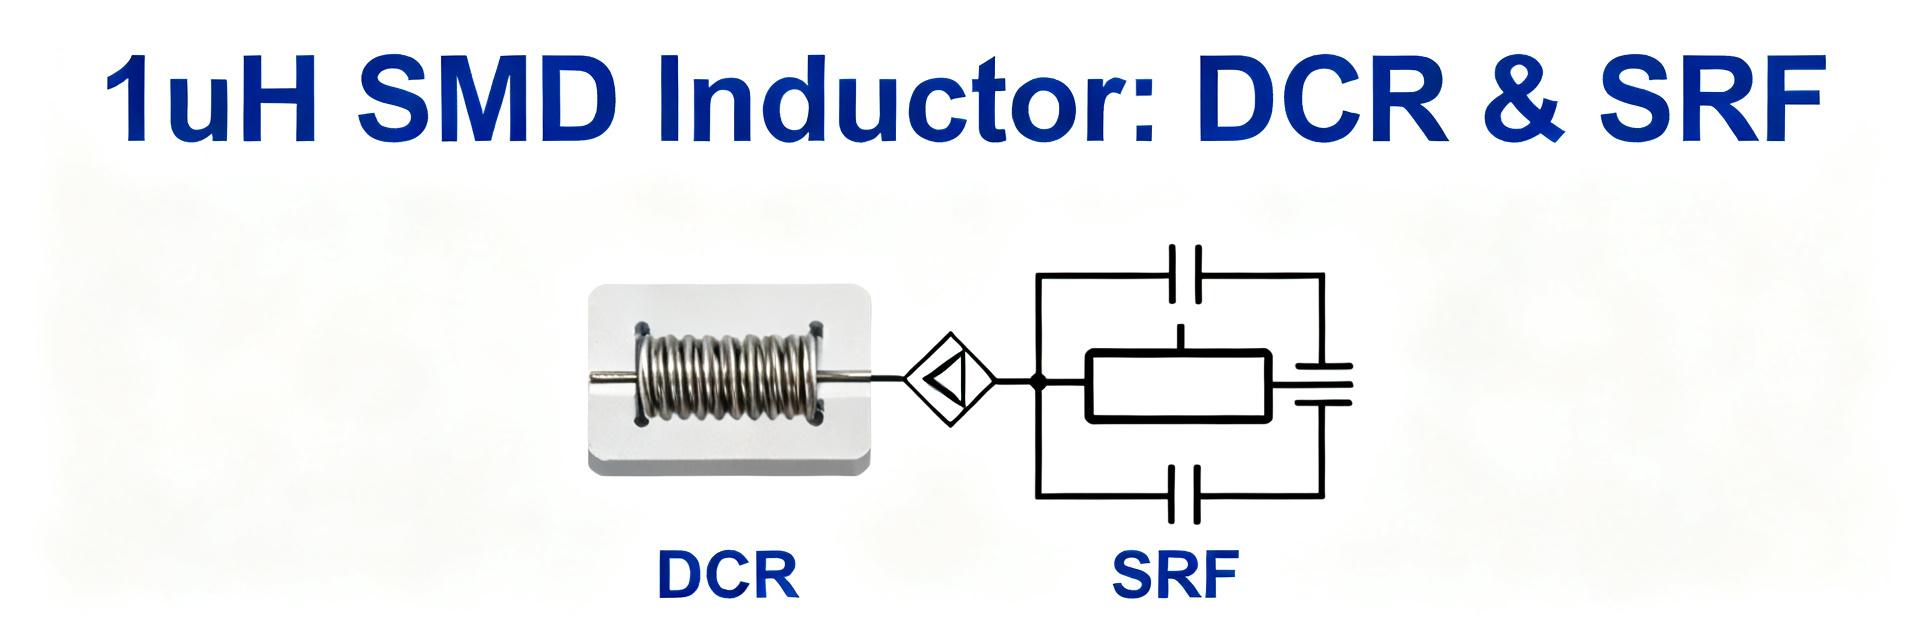
Point: Nominal inductance is measured under specific conditions; frequency alters L and impedance. Evidence: datasheet measurement frequency and fixture are essential when reading L(f) curves. Explanation: when an L(f) plot shows falling inductance with rising frequency, resonance (SRF) and EMI behavior follow; use the datasheet impedance curve to predict resonant peaks and to size accompanying damping or snubbing if needed.
Current ratings, DCR, and loss mechanisms
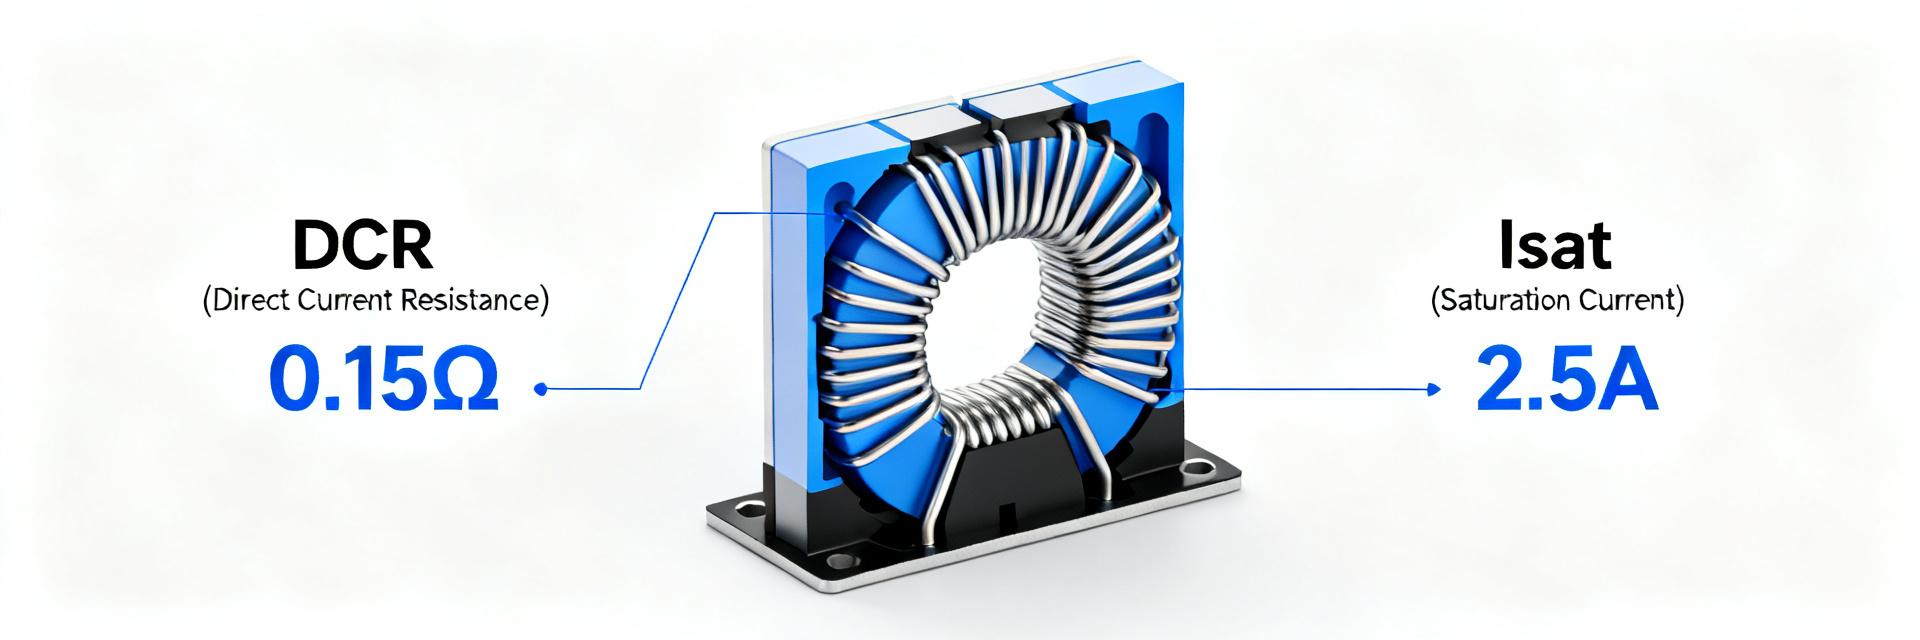
Point: Isat and Irms define usable current range; DCR controls I²R losses. Evidence: datasheet defines Isat (L drop criterion, usually 20–30%) and Irms (temperature-rise criterion, commonly ΔT = 40 °C) and publishes typical DCR. Explanation: compute copper loss as P = I²·DCR and add core loss from datasheet loss graphs. Worked example: for a known DCR value (see datasheet) and 8 A RMS, P_loss = 64 × DCR; include core loss contribution per current and frequency curves in the datasheet when budgeting total loss.
Thermal and mechanical specifications — reliability considerations
Thermal limits, derating, and soldering
Point: Thermal margin determines continuous current capability and long-term reliability. Evidence: datasheet provides operating temperature limits and often recommends derating rules. Explanation: apply conservative derating — for example, reduce Irms allowance by 10–25% as ambient approaches high end of specified range; follow the manufacturer’s reflow profile and handling instructions to avoid solder-induced stress or magnetic property changes.
Package dimensions, PCB footprint and layout tips
Point: PCB land pattern and via placement affect parasitics and thermal dissipation. Evidence: footprint drawing in the datasheet gives recommended land pattern and keep-out areas. Explanation: center large copper pours on both sides, place thermal vias near pads to lower temperature rise, and minimize loop area between the inductor and switching device to reduce EMI; mechanical height (3.1 mm) must be considered in enclosure stack-up.
Performance testing & bench validation (method guide / case)
How to measure Isat, DCR and SRF in-house
Point: Repeatable lab methods verify datasheet claims and reveal production variation. Evidence: common instruments include an LCR meter or impedance analyzer, DC current source, and thermal chamber or controlled ambient. Explanation: measure Isat by applying incremental DC bias and recording L until it drops by the datasheet-specified percentage (commonly 30%); measure DCR with a four-wire micro-ohmmeter and control temperature; find SRF with an impedance analyzer sweep to identify resonant peak.
Interpreting datasheet values vs. lab results
Point: Expect differences due to test fixture, temperature and measurement frequency. Evidence: datasheet conditions are controlled and sometimes idealized. Explanation: adjust expectations by accounting for fixture inductance, higher ambient temperature and soldering effects; design margins of 70–80% of Irms for continuous operation help absorb these variances.
Selection checklist & procurement guidance (action)
Quick selection checklist for designs
Point: A short checklist prevents oversights during part selection. Evidence: checklist items map directly to datasheet sections. Explanation: verify required inductance and tolerance, continuous (Irms) and peak (Isat) current needs, permissible DCR and loss budget, mechanical envelope and height, thermal margin, and switching frequency compatibility; mark each item against the datasheet before procurement.
Sourcing, lifecycle and documentation to request
Point: Documentation ensures long-term design support. Evidence: manufacturers publish datasheet PDF, footprint drawings and reliability notes. Explanation: download and archive the full datasheet, footprint drawing, soldering/reflow profile, and any qualification reports; check lifecycle status and revision history and request updated datasheet revisions when sourcing in production quantities.
Summary
Point: The AMELH6030S-3R3MT is a compact 3.3 µH SMD power inductor whose datasheet-driven specs—current ratings, DCR, thermal limits and package dimensions—determine suitability for high-current DC–DC designs. Evidence: the datasheet lists the definitive numeric limits and test conditions that govern real-world performance. Explanation: consult the official datasheet for exact numeric values, run the bench tests outlined above and use the selection checklist when choosing this part for production.
Key summary
- Headline spec: 3.3 µH in ~6.8×6.6×3.1 mm — verify tolerance and test frequency in the datasheet before final selection.
- Current & loss: confirm Isat and Irms and use P = I²·DCR plus core-loss graphs from the datasheet for power budgeting.
- Thermal care: derate near high ambient temperatures and follow the datasheet reflow/handling guidance to preserve magnetic properties.
- Layout: use the datasheet footprint, add thermal vias and minimize switching loop area to reduce EMI and temperature rise.
Frequently asked questions
What is the recommended way to verify Isat from the datasheet?
Measure inductance under increasing DC bias using an LCR meter or impedance analyzer, noting the DC current where L decreases by the datasheet-defined percentage (commonly 20–30%). Control ambient temperature and use a stable current source; report both measured Isat and test conditions for traceability.
How should I account for DCR in thermal budgeting?
Use the typical or maximum DCR from the datasheet to compute I²R losses at expected RMS currents, then add core losses from datasheet plots. Translate total losses to temperature rise via thermal resistance or empirical board-level measurements, and ensure margins so the part stays within rated temperature limits.
How closely will lab SRF and impedance curves match the datasheet?
Lab results may shift due to test-fixture parasitics, soldering and ambient conditions. Expect small frequency offsets; use the datasheet curve as a baseline and measure the installed part on an actual PCB to capture real-world SRF and impedance behavior for EMI and resonance analysis.